The 5 JavaScript Debugging Tools that Every Developer Should Know About
We think that the every single developer at least once had a situation when he looks at the code and can not understand – why! Why does it do something unexpected? However, from all these surprises, in any case, we must get rid of.
- Before you throw everything else, throw yourself into the heap found somewhere lines of programs that seem to be able to solve your problem, please answer three questions:
- What actions do you expect from your program?
- Why do you expect this from the program?
- Does the program do what you expect of it?
- If you can not answer the first two questions, we wish you luck in the copy-paste, but if you know what you expect from the code and why there are tools that can help you understand if the code does what is expected of it.
After you make sure that your expectations for a certain fragment of the program were justified, or you were able to correct the error – go to the next fragment and verify it. Here are a few useful tools that will help you bring bugs to clean water.
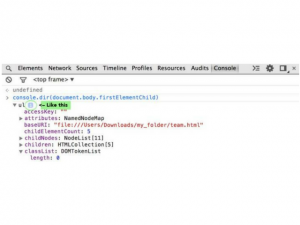
When you need to verify a Variables value
Let’s start, outside the main list of debugging tools, from the simplest and most obvious. The console.log () command can be very useful for checking things like variables declared with var and let, constants declared using const, arguments and this objects. At the time the value is displayed, these data are up-to-date, but be aware that sometimes the Chrome console displays data that was updated after the program was run. Be wary of the data, after which there is a light blue badge with the white letter ‘i’.
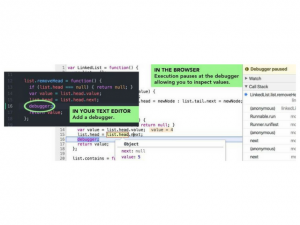
# 1: Chrome Developer Tools – Debugger
A more reliable alternative to using console.log-ing is the Chrome debugger. In order to use it, add the debugger statement to the line of your code in which you would like to explore the values of variables. Save the file, then open the Chrome Developer Toolbar, for example, with the following commands:
iOS: Cmd + Opt + I
Windows: Ctrl + Shift + I
Go to the page whose code you are researching, say, it could be something like localhost: PORT_NUMBER or the address of the page on the site being developed, or, if the page is already open, reload it. The execution will pause on the debugger command and you will be able to explore the program.
- Using the debugger command is similar to adding a breakpoint from the Sources pane in the browser, but the main difference to notice is that breakpoints are bound to row numbers. Suppose you put a breakpoint on line 20, and then reworked the code and deleted line 8. What was on line 20 will now be in line 19 and you’ll have to reset the breakpoint to a new location. Details about debugging in Chrome and various useful information about this process can be found by referring to the documentation.
Note that similar debugging tools are available in Firefox, Safari, and Edge.
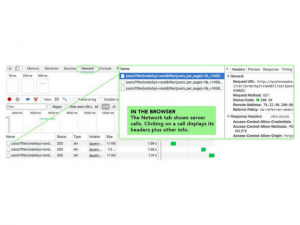
Chrome Developer Tools – Network Tab
# 2: React Developer Tools
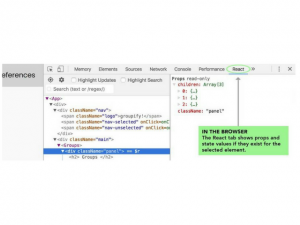
If your application is based on React and you need to check the values of properties or states, you should check out the React Developer Tools for Chrome extension. It will immediately become your best friend.
- By adding this extension to Chrome and going to the page created with React, you will see the React tab in the Developer Console, which displays the property and state values for the item you click on.
# 3: Debugging Server Code and Node Inspect
So, you are sure that the program works, that the data goes to the server, but do not know if Node or Express router and process the request correctly. If you use an application that you can not look at the source code, for example, it is some kind of third-party API, then read the documentation. If you yourself develop and support the server, then you should get acquainted with Node Inspect.
Node Inspect is similar to the Chrome developer tools, but it is intended for server code. Before using this tool, check the Node version, it must be at least 6.6, and the version of Chrome, which must be at least 55. If these requirements are met, open a command prompt and run the following command:
node --inspect PATH_TO_YOUR_SERVER_FILE
- After that, you should see the message in which the link is most interesting to us.
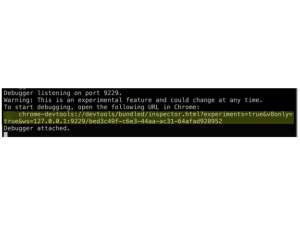
This link should be opened in the browser, after which it will be possible to use familiar tools for debugging server code.
If you want to be at the forefront of progress in the debugging area, take a look at this material, which examines the setting of the environment for the simultaneous debugging of client and server JavaScript programs in the same Chrome developer
# 4: Server Response Check – Postman
If you are sure that the request was sent to the server, but you do not know exactly what it looks like, what came in response, or even whether something came at all, Postman will help you to understand the situation. Although this comrade is not a superman from comics, he certainly saved several developers.
- Postman is a desktop application, it should be downloaded and installed. It allows you to select the type of request (among them – GET, POST, PUT, PATCH, DELETE), and the endpoint you need, and if necessary – then the data for authentication, and send a request to the server. The server’s response will appear in the application on the Body tab.
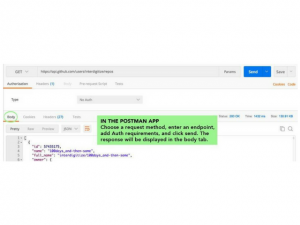
This tool is very useful in cases when you need to make sure that what you expect from the server comes from the server, that is, make sure that the function on the client, which processes the server’s responses, will be able to understand the received data. Details about working with Postman can be found in its documentation.
# 5: Syntax Errors and Webpack
In the fight against syntax errors is very useful linter, connected to a text editor, for example, ESLint. Error messages in the browser console or on the command line also usually help to understand what to look for and what line to look for in the text to correct the syntax error. Another useful means of checking the syntax, although less well known in this capacity is Webpack. Yes – this is the same Webpack that is used to compile modules.
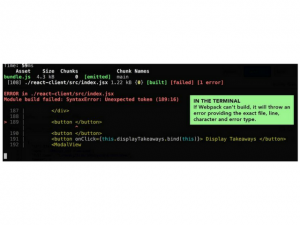
If Webpack can not build the module, it will generate an error message, from which you can learn a lot of useful information. Therefore, if you update the page, and nothing new appears in the browser, take a look at what Webpack displays in the terminal and see if it can compile what you are trying to work with.
Conclusion: What to do if the error does not disappear?
If you, despite everything, can not cope with the error, prepare a short and accurate question, ask the supervisor, a colleague, or ask for advice on some suitable forum. Your problem will certainly be solved.
Dear readers! How do you search for errors in JavaScript code?
